Dashboards
Live dashboards your team and clients will actually open
Put the numbers that matter on one screen, from every connected source. Build it by hand or ask the AI assistant, then share it, email it every morning or put it on the office TV.

01
Build it your way
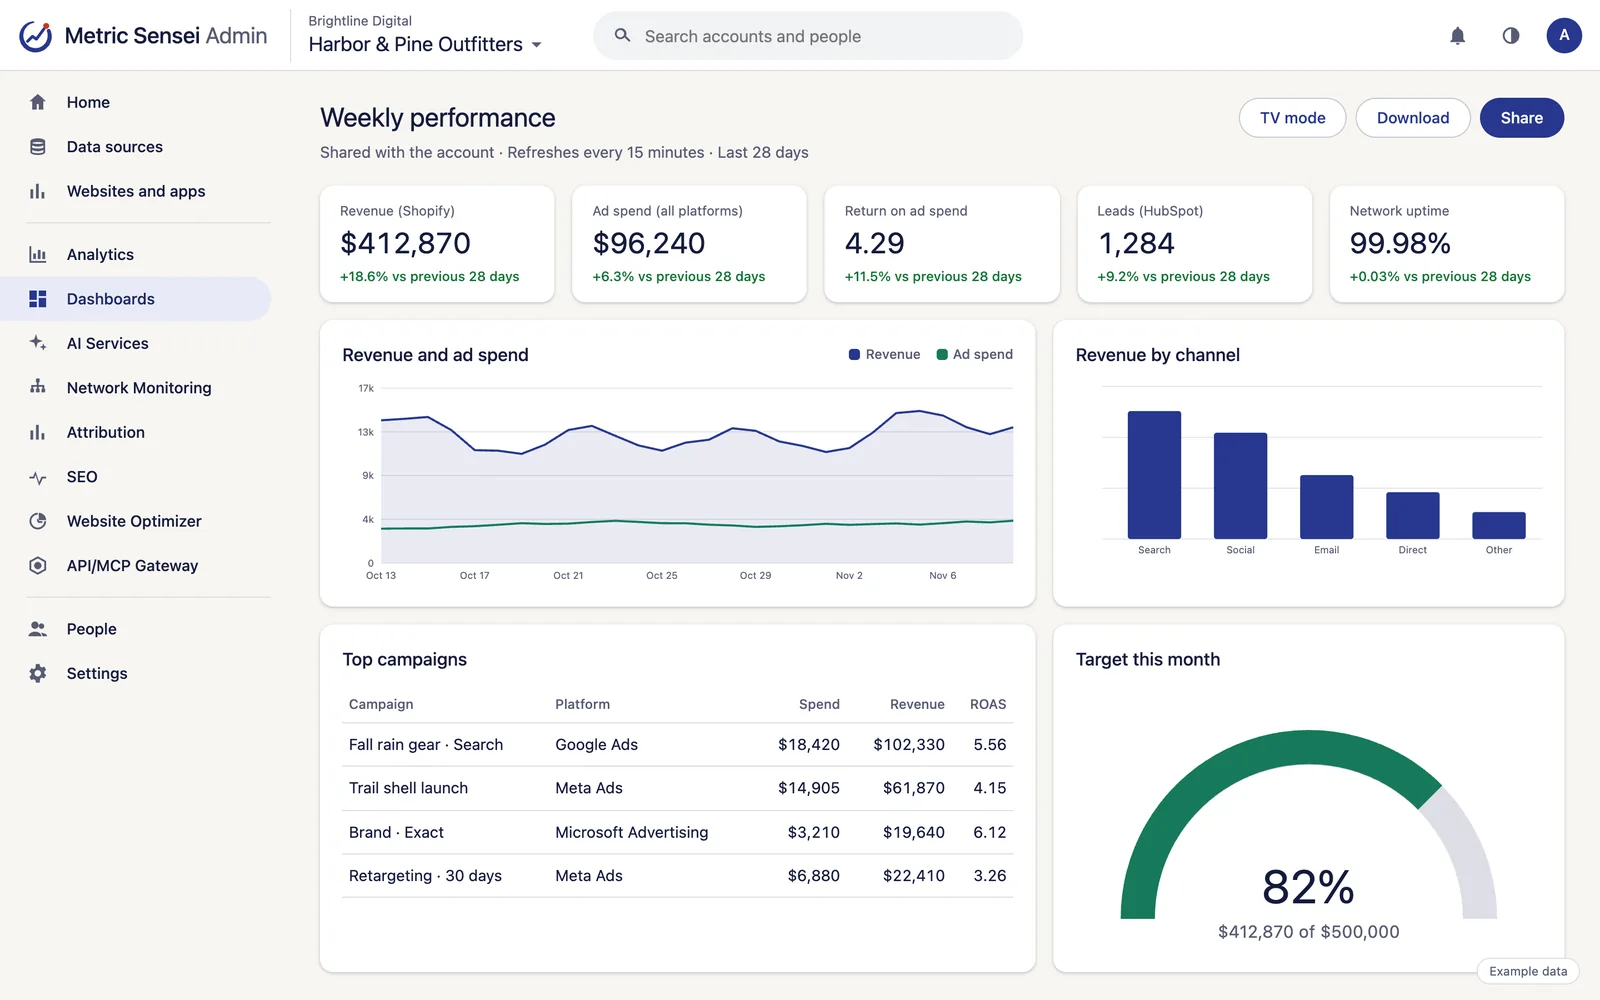
A grid of tiles: a number with its change and target, line, bar and column charts, tables, leaderboards, gauges and text.
- Pick any date range and compare it with the period before or the same time last year; viewers can change the dates without changing the saved dashboard.
- Dates are relative ("last 28 days", "this month"), so the dashboard stays current.
- Refreshes every 5 to 60 minutes, or every minute when you need it.
- Ask the AI assistant to build or change one. It shows you the result before saving.
- Ready-made totals for sales from Shopify and WooCommerce, ad spend from every platform, calls, leads and network uptime.
02
Share safely
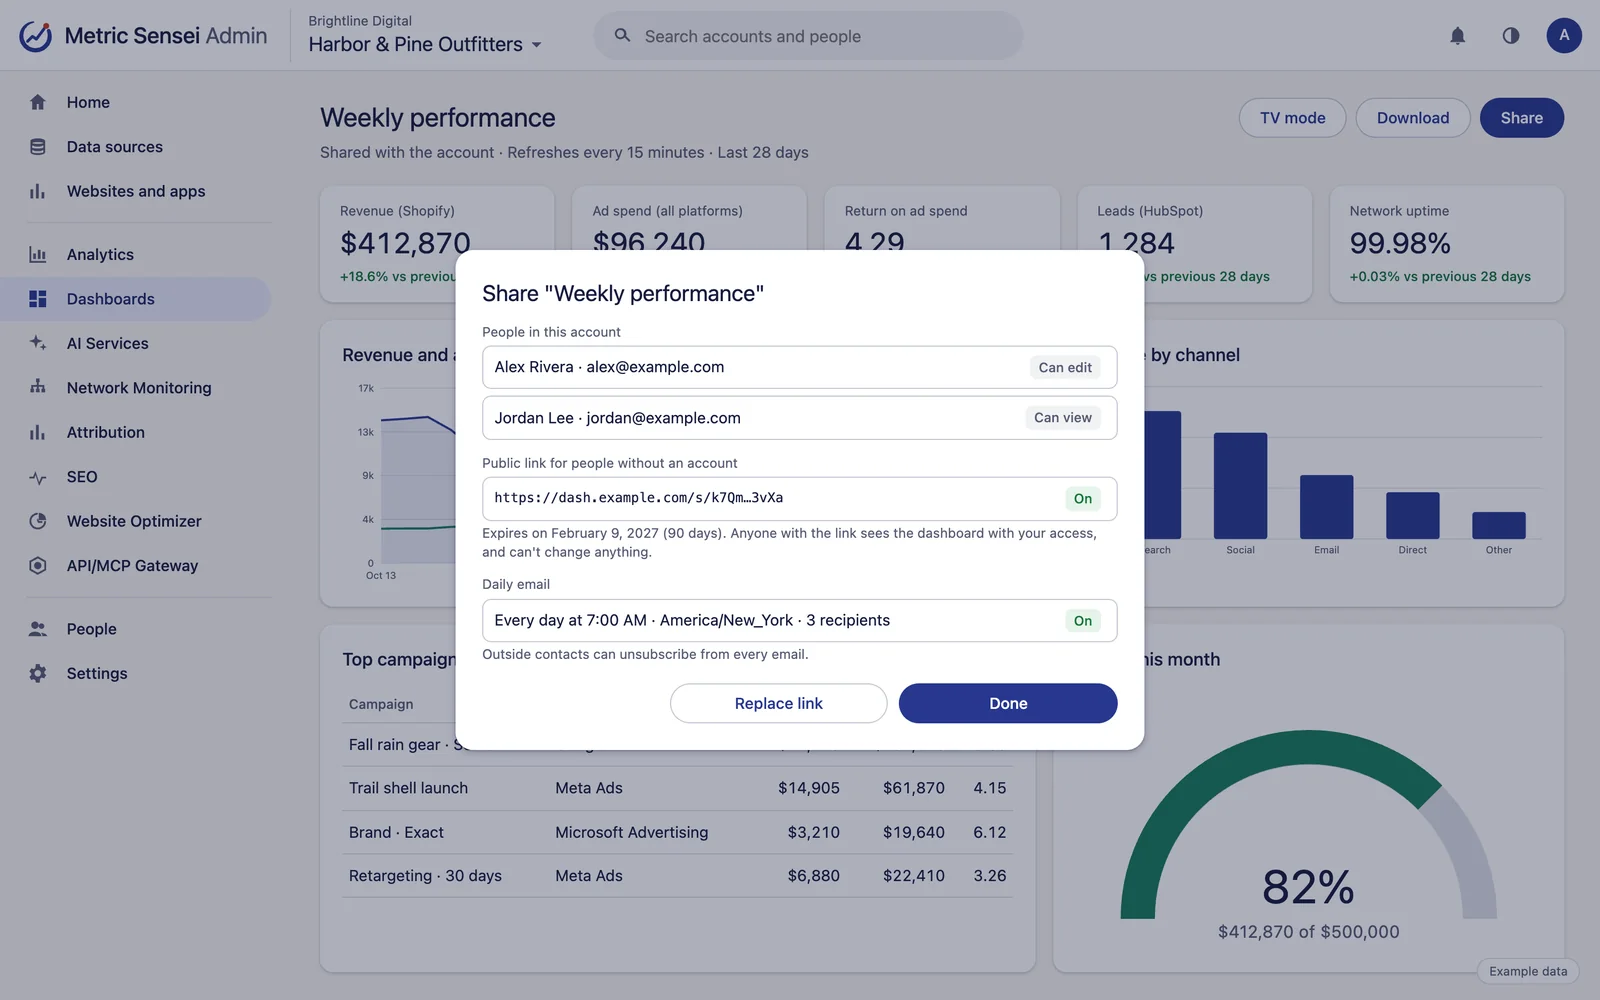
Every dashboard starts private. Share it with the whole account or with chosen people, and each person sees data with their own access.
- Public links for clients without an account: long, random, and they expire after 90 days unless you change it.
- Only admins can make public links, and a link can be replaced or turned off at any time.
03
Take it anywhere
Download a PDF that looks like the screen, an Excel file with one sheet per tile, or a picture.
- Daily email at the time and time zone you choose, to people in the account and outside contacts.
- Outside contacts can always unsubscribe.
- TV mode for the office wall.
Works with
Uses the accounts you already have.
Connect each account once and every service can use it.
Google Analytics 4
GA4 reports and history beside our own numbers, plus property settings.
Google Ads
Campaign, keyword and search-term performance, Local Services Ads leads, conversions sent back, and changes with your approval.
Meta Ads
Facebook and Instagram ad performance, audiences and pixels, with Conversions API sends from Attribution.
Microsoft Advertising
Bing and Microsoft ad performance, conversion goals and UET tags, with offline conversions sent back.
Shopify
The Metric Sensei app adds the tag and a Web Pixel for checkout, reads orders, products and customers, and matches customers to their visits.
WordPress
The Metric Sensei plugin adds the tag, saves form submissions with their source and connects the site.
HubSpot
Contacts, companies, deals, forms, marketing emails and campaigns, with won deals sent to the ad platforms.
Salesforce
Leads, opportunities, campaigns, reports and dashboards, with lead sources filled in and won deals sent to the ad platforms.
Oracle NetSuite
Customers, leads, transactions and sales summaries from your ERP.
Klaviyo
Email and SMS campaigns, flows, sign-up forms, lists, segments and their results.
CallRail
Calls, texts and form submissions, matched to the visit and campaign that started them.
Supermetrics
Reach the platforms your Supermetrics team already connects, such as LinkedIn and TikTok.
See every integration.
Who uses it

Online stores
Sales, spend, email, support and shipping in one place, with every order traced to its source.

Lead generation and local services
Every form, call and chat traced to its campaign, with dashboards and AI on top.


Multi-location businesses and IT teams
Watch the network at every location, and the websites and accounts that bring in customers.

Data and AI teams
One API and MCP server for every connected account, and raw events in your warehouse.
Questions
Common questions
Which sources can a tile use?
Any connected data source, plus Metric Sensei's own Attribution, Analytics, SEO, Website Optimizer and Network Monitoring data.
What does a client see on a public link?
The dashboard as you built it, with the data your own access allows. They can't change it or open anything else.