Network Monitoring
Network monitoring for every location you look after
Know when a router, switch, server, website or connected account stops working, before your users tell you. Collectors check private networks from the inside, our cloud checks everything public from two regions, and alarms go to whoever is on call.
01
Locations and collectors
Each location lists the networks it covers. A small collector (Docker or a single program) checks its devices and only ever connects out over HTTPS.
- Run two collectors at a location and they share the work and cover for each other.
- Public addresses are checked from our cloud in two regions; a device is down only when both agree.
02
Checks
Ping, SNMP v1, v2c and v3 (interfaces, traffic, errors, CPU, memory, disks, uptime), HTTP and HTTPS, certificates, TCP ports and DNS.
- SSH and PowerShell command checks, and standard Windows checks.
- Thresholds on any measurement, SNMP traps and syslog with built-in and custom rules.
- UniFi controllers and UniFi Site Manager, with every device followed by MAC address.
03
Discovery and maps
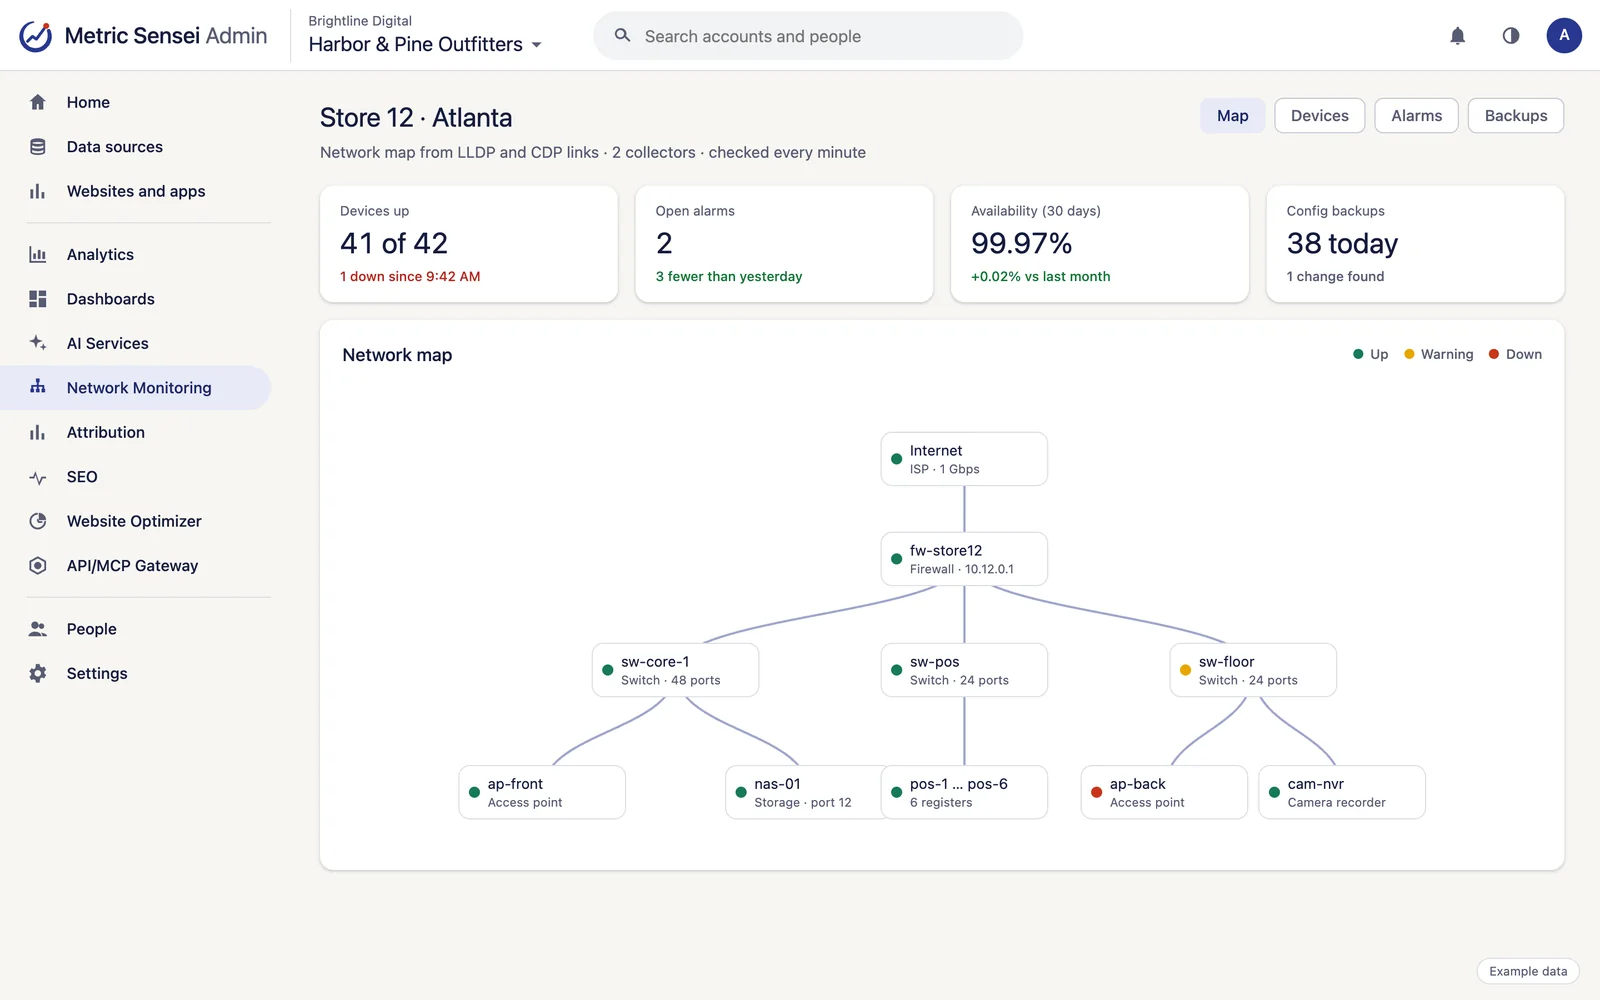
Sweep an address range and devices are recognised by vendor and type, then added by your rules or listed for review.
- Network overview from LLDP and CDP links, and a site map that shows each device on its switch port.
- Every connected device with its IP, VLAN, switch and port.
- Top talkers from NetFlow, IPFIX and sFlow.
04
Alarms that make sense
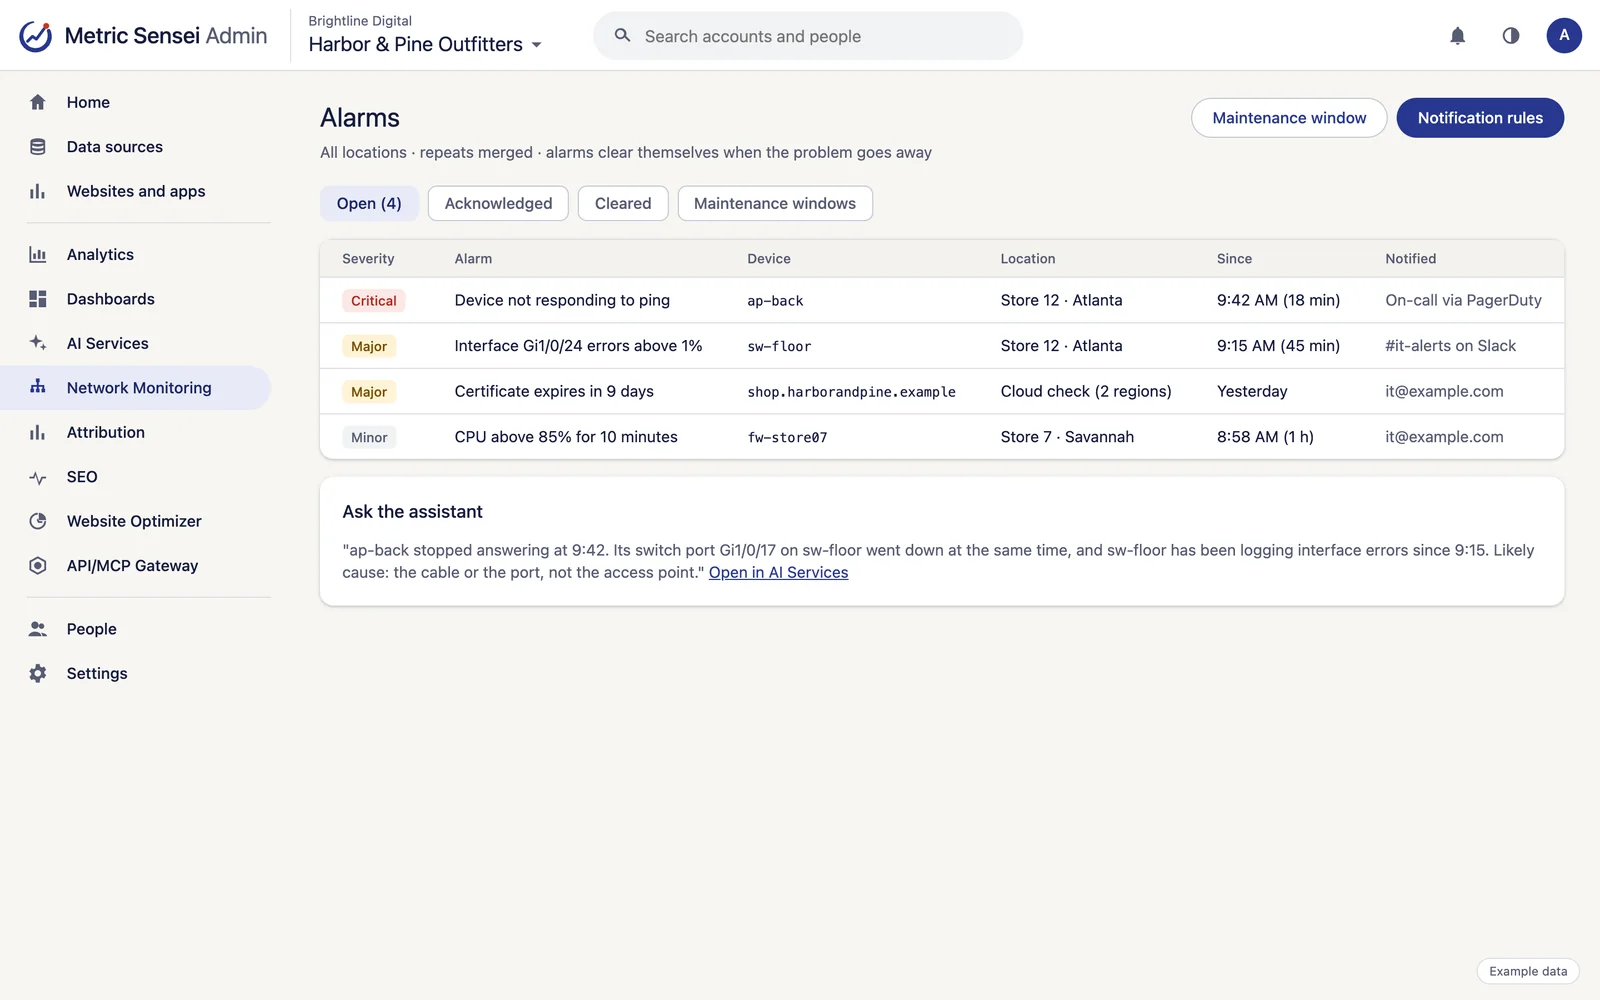
Repeats are merged, alarms clear themselves when the problem goes away, and a device that is down holds back the alarms of its services.
- Notify by email, text message, Slack, Microsoft Teams, PagerDuty or signed webhook, with delays and escalation steps.
- Maintenance windows for planned work, and device groups to aim rules at.
- Outage history and a monthly availability report.
05
Config backups
Daily configuration backups with differences highlighted, for Cisco, Juniper, Arista, HPE Aruba, FortiGate, Palo Alto, MikroTik and EdgeOS.
06
Your marketing stack, watched too
Every website you track in Metric Sensei and every connected data source's API, from Google and Shopify to HubSpot, RingCentral and NetSuite, is monitored automatically, so a broken store or an expired connection doesn't go unnoticed.
- The AI assistant can read an alarm's context and suggest a likely cause.
Who uses it


Multi-location businesses and IT teams
Watch the network at every location, and the websites and accounts that bring in customers.

Data and AI teams
One API and MCP server for every connected account, and raw events in your warehouse.
Questions
Common questions
Do I need to open ports in my firewall?
No. Collectors only make outgoing HTTPS connections to us.
Where are passwords and SNMP communities kept?
Encrypted in your account's sealed store, never readable in our database.
Can an agency or IT provider use it for many clients?
Yes. Each client is its own account with its own locations, collectors and alarms, all under one sign-in.